Here is the data folks submitted to the Google Form in class today. I sorted according to each variable so you can easily figure out mean, median and mode etc. Use this data to complete the handout you received in class on Friday. THEN... read below to learn how to complete this assignment on in a comment on this blog post. I wonder why some folks are missing from the data...
 |
NOTE: There are two people who listed their height as 63 and 64 cm. Since nobody in our class is around two feet tall, I assume those are errors. Before I graphed the data I added a "1" to each so they became 163 and 164 cm. In psych or any type of research, our conclusions are only as good as the data we use to form them. How we deal with errors in data collection is an important issue.
I strongly suggest you write the comment in Word or another program and then copy and paste it into the comment section below. This way, if the comment doesn't go through or is accidentally deleted you'll have a record of your work. Please also remember that I have to approve all comments, so it may take a while for it to show up on the blog. You don't need to resubmit it over and over.
Click on graphs to enlarge.
What can we see from the above scatter plot of hair length vs. height? Is there a correlation? How strong is it? If so, is it positive or negative; strong or weak?
Graph 2
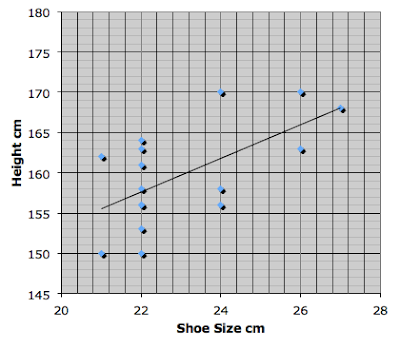
Height vs. Shoe Size
Height vs. Shoe Size
 |
| Height vs. Shoe Size Correlation Coefficient 0.61 |
Above is the data we collected about our shoe sizes vs our heights. Can you see a relationship? Is there a correlation? If so, is it positive or negative? How strong is it? Does shoe size cause height to change? Does height cause shoe size to change? Why are some values so common?
Graph 3
Shoe Size vs. Hair Length
 |
| Shoe Size vs. Hair Length Correlation Coefficient -0.82 |
Finally, the above graph shows the relationship between shoe size and hair length. Is there a correlation? If so, is it positive or negative? How strong is it? Are the points clustered in an interesting way? What third variable which is not shown on any of the graphs might be causing the relationship between shoe size and hair length? Does correlation imply causation? Why or why not?
And a video about ice cream and polio...
Hank on Research Methods
And... more about the Standard Deviation
While you don't need to calculate the Standard Deviation on the AP exam, this video explains how to do it. You may find it helpful to go through the math to help you understand the concept better.


